Diridzira


Large CO2 and CH4 Emissions from Polygonal Tundra During Spring Thaw in Northern Alaska
Naama Raz-Yaseef, Margaret S. Torn, Yuxin Wu, Dave P. Billesbach, Anna K. Liljedahl, Timothy J. Kneafsey, Vladimir E. Romanovsky, David R. Cook, Stan D. Wullschleger
Geophysical Research Letters (2016), doi: 10.1002/2016GL071220
We measured a large pulse of carbon gasses emitted from the soil in the early thaw of May 2014. The pulse was so large that it offset nearly half of the following summers' plant net carbon uptake. The same pulse was measured at a different flux tower, 5 km away, indicating that this is a regional phenomenon. From other lab experiments (soil core thawing) and field measurements (soil gas content), we learned that the source of these emissions is a build-up of gasses in the soil during the fall. The carbon gasses are produced by microbial activity in a mid-depth soil layer that freezes last, and are trapped over-winter beneath the surface ice. Emission pulses were linked to unique rain-on-snow events enhancing soil cracking. The conditions that lead to the pulse spring emissions may become more frequent in the future with climate change.

Air temperature and soil temperature averaged for shallow depth (2–15 cm), the midlayer (15–50 cm), and permafrost (50–150 cm). (left) The fall and freeze-in seasons are shown; winter is discontinued, and (right) the spring-thaw and summer seasons are also presented. Measurements of snow cover (%) and photos taken at the BEO prior and during snowmelt are also shown.
Vulnerability of crops and native grasses to summer drying
in the U.S. Southern Great Plains
Naama Raz-Yaseef, Dave P. Billesbach, Marc L. Fischer, Sebastien C. Biraud, Stacey A. Gunter, James A. Bradford, Margaret S. Torn
Agriculture, Ecosystems and Environment (2015) 213: 209–218.
The Southern Great Plains are characterized by a fine-scale mixture of different land-cover types, predominantly winter-wheat and grazed pasture, with relatively small areas of other crops, native prairie, and switchgrass. Recent droughts and predictions of increased drought in the Southern Great Plains, especially during the summer months, raise concern for these ecosystems. We measured ecosystem carbon and water fluxes with eddy-covariance systems over cultivated cropland for 10 years, and over lightly grazed prairie and new switchgrass fields for 2 years each. Growing-season precipitation showed the strongest control over net carbon uptake for all ecosystems, but with a variable effect: grasses (prairie and switchgrass) needed at least 350 mm of precipitation during the growing season to become net carbon sinks, while crops needed only 100 mm. In summer, high temperatures enhanced evaporation and led to higher likelihood of dry soil conditions. Therefore, summer-growing native prairie species and switchgrass experienced more seasonal droughts than spring-growing crops. For wheat, the net reduction in carbon uptake resulted mostly from a decrease in gross primary production rather than an increase in respiration. Flux measurements suggested that management practices for crops were effective in suppressing evapotranspiration and decomposition (by harvesting and removing secondary growth), and in increasing carbon uptake (by fertilizing and conserving summer soil water). In light of future projections for wetter springs and drier and warmer summers in the Southern Great Plains, our study indicates an increased vulnerability in native ecosystems and summer crops over time.

Coarse root distribution of a semi-arid oak savanna estimated with ground penetrating radar
Naama Raz-Yaseef, Dennis D. Baldocchi, Laura L. Koteen
Journal of Geophysical Research – Biogeosciences (2013) 118: 1-13.
The binary nature of Northern California’s ecohydrology, in which water is either
abundantly available or scarce, should be reflected in the root architecture of the native blue oak. Our objective was to quantify carbon storage and understand how the form of the root system facilitates ecosystem functioning despite the asynchrony between winter water
availability, spring leaf growth, and dry-summer canopy maintenance. To do this, we
surveyed coarse root distribution with a ground penetrating radar (GPR), due to its
advantages in covering large areas rapidly and non-destructively. We calibrated root
biomass detected by GPR against roots excavated from a number of small pits. Based on a
survey of six tree configurations (varying in age, size, and clumping), we found that coarse
roots occupy the full soil profile and that coarse root biomass of old large trees reached a
peak directly above the bedrock. As opposed to other semi-arid regions, where trees often
develop extensive shallow lateral coarse roots to exploit the entire wet-soil medium, we
found that root density decreased with distance from the bole, and dropped sharply beyond
a distance of 2m. We upscaled tree root biomass to stand scale (2.80.4 kgm2) based on
lidar analysis of the relative abundance of each tree configuration. We argue that this deep
and narrow root structure reflects the ecohydrology of oaks in this ecosystem. An extensive
lateral root system would not be beneficial during the growing season, when water is
sufficiently abundant, nor during summer, when soil water is highly limited.

GPR reflection intensity (factory-defined output units are milli-volt/1.56) for each of the surveyed grids. High intensity denotes the existence of roots. The larger roots were digitized to improve their appearance (no change in the values used for calculations). Variations in grid size are a result of field limitation. The depth of the specific layer presented is noted above the image. Full rectangles denote the tree bole position. Empty rectangles denote the locations of the excavated pits. Empty polygons denote roots revealed for verification.
What makes the ecosystem tick: challenges in revealing water controls over ecosystem fluxes in a semi-arid oak-grass savanna

Tree locations mapped from satellite imagery. Soil depth mapped with EMI.
Dynamics of evapotranspiration partitioning in a semi-arid forest as affected by temporal rainfall patterns
Naama Raz-Yaseef, Dan Yakir, Gabriell Schiller, Shabtai Cohen
Agricultural and Forest Meteorology (2012) 157: 77-85
We extend our recent study of the effects of tree density on evapotranspiration (ET) partitioning in a semi-arid pine forest by examining the influence of the temporal patterns in rainfall (P) on the dynamic contributions of tree transpiration (Tt), soil evaporation (Es) and rainfall interception (IP) to total ET. Soil evaporation accounted for 39% of average annual ET over the four-year period, and was associated with soil moisture content in the upper 5 cm and solar radiation, therefore peaking during the wetting and drying seasons (up to 0.75 mm day−1). In the dry summer, Es diminished and as much as 50% of the
residual flux was due to re-evaporation of moisture condensed at night (adsorption). Tree transpiration accounted for 49% of average annual ET, and was associated with soil moisture at a depth of 10–20 cm. Transpiration peaked only in late spring (1.5 mm day−1), after the accumulation of large storms allowing infiltration below the topsoil. Moisture at these depths was maintained for longer periods and was even carried over between rain seasons following a high precipitation year. Interception was 12% of annual ET but was larger than 20% during the rainy period. The results indicated that both Tt/ET and Es/ET could vary between 30% and 60% due to their differential response to seasonal environmental drivers. Annual Tt/ET, a major parameter indicating forest productivity and survival, was more influenced by the occurrence of large storms (>30 mm; P30/P ratio) than by P itself. In an assessment of the potential warming and drying trends predicted for the Mediterranean region in the next century, changes in both total precipitation and in its temporal patterns must be considered.
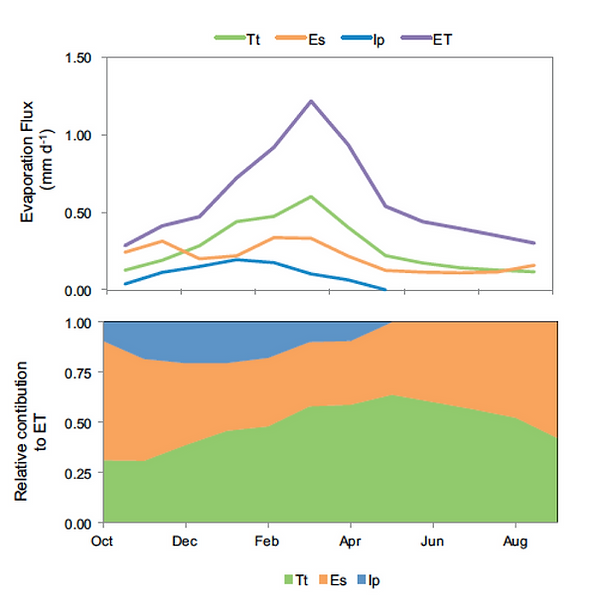
Upper panel: monthly averages (mm day−1) of the separate fluxes of tree
transpiration (Tt), soil evaporation (Es) and intercepted precipitation (IP) for the research period. Lower panel: relative contribution of each of these fluxes to total ET. The seasonal cycle, as well as the relative contribution of each flux, was different for each of the fluxes.

Effects of spatial variations in soil evaporation caused by tree shading on water flux partitioning in a semi-arid pine forest
Naama Raz-Yaseef, Eyal Rotenberg, Dan Yakir
Agricultural and Forest Meteorology (2010) 150: 454-462.
In dry environments, water availability is a major limitation to forest productivity while losses to soil evaporation (E) are a significant component in ecosystem hydrology. We report on a 3-year study (2004– 2007) in a semi-arid pine forest in Southern Israel (40-year-old Pinus halepensis; leaf area index = 1.5; mean precipitation 285 mm year-1) that estimated soil E, assessed its spatial variability and identified the factors influencing it. We used a modified and specially calibrated soil respiration chamber to directly measure E on a weekly basis at 14 permanently installed soil collars across the range of soil surface conditions. Results showed that spatial variability in E was large, with SD of 47% between measurement sites. E fluxes measured in sun-exposed areas were on average double those in shaded areas (0.11 mm h-1 vs. 0.06 mm h-1). The spatial variability in E correlated with radiation (measured in the photosynthetically active range), which was up to 92% higher in exposed compared to shaded sites, and with soil water content, which was higher in exposed areas during the wetting season but higher in shaded areas during the drying season. The fraction of shaded forest floor area was described as a function of canopy geometry (mean tree height, crown widt, and stand density) and the daily variation in solar altitude. Simple simulations based on the relationship between E and the shaded fraction indicated that E/P (precipitation) for the Yatir forest could decrease from 0.53 (undeveloped canopy of 10% cover) to 0.30 (full canopy closure). However, according to our analysis, increasing canopy cover will also increase intercepted precipitation and transpiration such that current precipitation inputs will not be able to support forest growth above a canopy cover of 65%. Combining direct measurements of environmental conditions and canopy characteristics with such simulations can provide a simple predictive and management tool to optimize tree water use in dry environments.
Ecohydrology of a semi-‐arid forest: partitioning among water balance components and its implications for predicted precipitation changes
Naama Raz-Yaseef, Dan Yakir, Eyal Rotenberg, Gabriell Schiller, Shabtai Cohen
Ecohydrology (2010) 3: 143-154.
The distribution of precipitation inputs into different hydrological components of water-limited forest ecosystems determines water availability to trees and consequently forest productivity. We constructed a complete hydrological budget of a semi-arid pine forest (285 mm annual precipitation) by directly measuring its main components: precipitation (P), soil water content, evapotranspiration (ET, eddy covariance), tree transpiration (sap flux), soil evaporation (soil chambers), and intercepted precipitation (calculated). Our results indicated that on average for the 4-year study period, ET accounted for 94% of P, varying between 100% when P < 250 mm and 85% when P > 300 mm (with indications for losses to subsurface flow and soil moisture storage in wetter years). Direct measurements of the components of the ET flux demonstrated that both transpiration and soil evaporation were significant in this dry forest (45% and 36% of ET, respectively). Comparison between ecosystem ET (eddy covariance measurements) and the sum of its measured components showed good agreement on annual scales, but up to 30% discrepancies (in both directions) on shorter timescales. The pulsed storm pattern, characteristics of semi-arid climates, was sufficient to maintain the topsoil layer wet during the whole wet season. Only less often and intensive storms resulted in infiltration to the root zone, increasing water availability for uptake by deeper roots. Our results indicate that climate change predictions that link reduced precipitation with increased storm intensity may have a smaller effect on water availability to forest ecosystems than reduced precipitation alone, which could help forests’ survival and maintain productivity even under drier conditions.

Hydrological processes in a small arid catchment: scale effects of rainfall and slope length
Aaron Yair and Naama Raz-Yaseef
Geomorphology (2004) 61: 155-169
Many studies have been concerned with the scale issue in geomorphology and hydrology. Most studies focus on the possibility of data transfer from small to large watersheds. Less attention has been given to the scale problem within very small watersheds where differences in slope length may seriously affect the spatial distribution and extent of runoff-contributing areas to the channel. It is usually assumed that runoff and erosion increase as slope length and angle increase. However, field observations in the Negev Highlands show positive relationships between slope length and deposition rates, regardless of slope angles. Short hillslopes are devoid of colluvial mantle, while thick colluvial deposits, with well-developed soil profiles indicative of long-term stability, are found at the base of long hillslopes. The hypothesis advanced is that temporal variations in effective rainfall control the spatial structures of surface properties that further enhance the effects of temporal variations in rainfall. Long-term monitoring of rainfall and runoff (1982–1998), conducted at spatial scales varying from few hundreds of m2 up to 0.3 km2, show a decrease in runoff at the hillslope scale. The low efficiency of runoff and erosion processes on long hillslopes is because the concentration time required for continuous flow along such slopes is longer than the duration of most effective rain showers prevailing in the area. Field data lead to the notion that runoff and erosion models in which a positive relationship between slope length and angle and runoff and erosion rates is assumed should not be applied to arid and semiarid areas. More attention should be given in latter areas to the complex hydrological relationships between rainfall scales and spatial scales. The implications of data obtained regarding the spatial distribution of areas contributing to channel flow, at a geological
time scale and under changing climatic conditions, are discussed.

The Sde-Boker experimental site.
Evapotranspiration across plant types and geomorphological units in polygonal arctic tundra
Naama Raz-Yaseef, Jessica Young-Robertson, Thom Rahn, Victoria Sloan, Brent Newman, Cathy Wilson, Stan D. Wullschleger, Margaret S. Torn
Journal of Hydrology (2017), 553: 816-825
Coastal tundra ecosystems are relatively flat, and yet display large spatial variability in ecosystem traits. The microtopographical differences in polygonal geomorphology produce heterogeneity in permafrost depth, soil temperature, soil moisture, soil geochemistry, and plant distribution. Few measurements have been made, however, of how water fluxes vary across polygonal tundra plant types, limiting our ability to understand and model these ecosystems. In this study we investigated how plant distribution and geomorphological location affect actual evapotranspiration (ET). These effects are especially critical in light of the rapid change polygonal tundra systems are experiencing with Arctic warming. At a field site near Barrow, Alaska, USA, we investigated the relationships between ET and plant cover in 2014 and 2015. ET was measured at a range of spatial and temporal scales using: (1) An eddy covariance flux tower for continuous landscape-scale monitoring; (2) An automated clear surface chamber over dry vegetation in a fixed location for continuous plot-scale monitoring; and (3) Manual measurements with a clear portable chamber in approximately 60 locations across the landscape. We found that variation in environmental conditions and plant community composition, driven by microtopographical features, has significant influence on ET. Among plant types, ET from moss-covered and inundated areas was more than twice that from other plant types. ET from troughs and low polygonal centers was significantly higher than from high polygonal centers. ET varied seasonally, with peak fluxes of 0.14 mm h-1 in July. Despite 24 hours of daylight in summer, diurnal fluctuations in incoming solar radiation and plant processes produced a diurnal cycle in ET. Combining the patterns we observed with projections for the impact of permafrost degradation on polygonal structure suggests that microtopographic changes associated with permafrost thaw have the potential to alter tundra ecosystem ET.
Monthly climate variables and fluxes measured at the Central Facility cropland site: (A) precipitation, (B) temperature, (C) soil water content at depth 10 and 30 cm, (D) fluxes of net ecosystem exchange (NEE) and evapotranspiration (ET), and (E) fluxes of gross primary production (GPP) and ecosystem respiration (Re). Growing season length (planting to harvest), crop type, and treatment are presented in (E).
Expected changes in the balance among hydrological flux components as a result of canopy growth in the Yatir forest. Shaded fraction (Sf, broken line) increased with growth, resulting in decreased E but increased precipitation interception (Ip) and tree transpiration (T). Excess water could result in runoff (for low-canopy cover) and/or increased T. Current precipitation (285 mm year-1, dotted horizontal line) will be wholly balanced by the sum of the hydrological components when a canopy cover of 65% (vertical dotted line) is reached.
Components of the hydrological cycle in the Yatir forest. Values are percentages of annual precipitation, averaged for the 4-year research period (285 mm). Precipitation intercepted by the canopy (EI) was calculated as the difference between precipitation (P) and through-fall (Pt). Tree transpiration (ET) was the largest flux, but soil evaporation (ES) was also a significant component in this system. Soil water adsorption (A) occurred on summer nights but re-evaporated during the following sunny hours, which balanced out on diurnal and longer timescales. Soil water storage (S) was significant only during one of the measured years, but on average for the research period was low. Negative values indicate an addition to precipitation inputs. Losses out of the system (L = D (deep drainage) + Q (runoff) + F (subsurface flow)) were estimated to be 7%.

(A) The field site is located near Barrow, on the coast of the Arctic Ocean. (B) Polygon microtopography at the research site captured by LiDAR. Location of the flux tower and footprint (white ellipse) are shown. Measurements with the portable chamber were conducted in the intensive research sites A, B, C and D. (C) The location of the automatic soil chamber and eddy-covariance tower. The main flux tower’s footprint (> 50% of the time) is shown (blue ellipse).